The Exhaustion Phase: Is Bitcoin Entering the Final Chapter of its Bear Cycle?
Key Takeaways
New on-chain data and shifting institutional flows suggest Bitcoin is entering a "exhaustion" phase, where selling pressure from retail holders is being neutralized by significant whale accumulation.
The atmosphere within the digital asset markets has shifted significantly over the last quarter, moving away from the high-volatility panic of earlier months toward a distinct period of exhaustion. While the prevailing macro environment remains complex, technical indicators suggest that the most aggressive phase of the current bear cycle may be reaching its conclusion. This transition is not marked by an immediate vertical price spike, but rather by a measurable decay in sell-side pressure and a fundamental shift in who is holding the supply.
This stage of the market is historically significant because it mirrors the "bottoming" behaviors observed in 2015, 2019, and 2022. During these periods, the primary catalyst for price stabilization was the capitulation of "weak hands"—traders who were forced to sell due to mounting losses—leaving behind a concentrated base of committed holders. By identifying these patterns now, market participants can begin to differentiate between temporary consolidation and the structural shift toward a new bull cycle.
Why do on-chain metrics suggest a cooling bear market?
The most compelling evidence for an approaching floor lies in the Realized Profit and Loss (P&L) Ratio, which has plummeted to -0.35, marking a 43-month low. In layman's terms, this indicates that a vast majority of current holders are sitting on unrealized losses. When most participants are "underwater," the urgency to sell diminishes significantly, creating a vacuum where demand can more easily overcome supply.
The UTXO Profit/Loss Ratio has entered a historical bottoming range. This suggests that the available liquidity for "panic selling" is drying up. Simultaneously, the supply of Bitcoin currently incurring losses has officially overtaken the supply held by profitable traders in this cycle. This shift effectively removes the immediate pressure on order books from participants who have already been "washed out."
Another critical metric is the Cycle Momentum, currently sitting at -30, and the Sharpe Ratio, which aligns with the -20 level observed during previous major cycle bottoms. While these figures still reflect a bearish environment, they indicate that the downward momentum is decelerging toward a structural floor rather than continuing in a linear descent.
Key Facts
- Realized P&L Ratio: -0.35 (a 43-month low).
- Supply Distribution: Loss-making supply now exceeds profitable supply for the first time this cycle.
- Whale Activity: Approximately 270,000 BTC ($16.7 billion) was accumulated by whales in a two-week window in June.
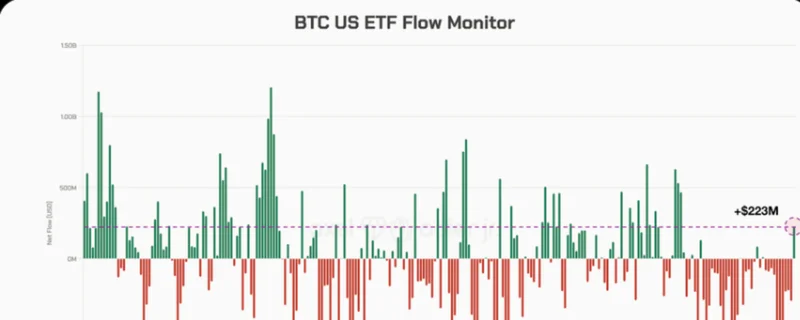
- ETF Volatility: Record $4.06 billion in outflows occurred in June, followed by a pivot to $223 million in inflows on July 4th.
- Specific Inflows: Fidelity (FBTC) saw $166 million; ARK (ARKB) saw $91.8 million.
- Macro Trigger: Lower than expected nonfarm payrolls (57,000 vs. 110,000) reduced the probability of aggressive Fed rate hikes.
How is institutional sentiment shifting in the ETF environment?
The relationship between spot ETFs and underlying Bitcoin liquidity has become a primary driver of market sentiment. While June was characterized by heavy outflows—totaling over $4 billion—the first week of July has signaled a divergence in how institutions are positioning themselves. This shift is not uniform; it highlights a growing divide between different investment vehicles.
While BlackRock’s IBIT saw outflows of approximately $40.4 million on July 4th, other major players like Fidelity and ARK showed significant appetite for the asset. The fact that July 4th saw the first daily total exceeding $200 million in inflows since May suggests a turning point in institutional sentiment. This pivot is likely linked to the recent labor data; as the probability of restrictive Fed policy faded, institutional allocators began rotating back into Bitcoin as a hedge against macroeconomic volatility.
| Date | Metric | Value/Observation |
|---|---|---|
| June (Total) | ETF Outflows | $4.06 Billion |
| July 4th | Net ETF Inflow | $223 Million |
| July 4th | Fidelity FBTC | +$166 Million |
| July 4th | ARK ARKB | +$91.8 Million |
| July 4th | BlackRock IBIT | -$40.4 Million |
What is the roadmap for a confirmed recovery?
For many, the question remains: when does "late-stage bear" become "early-stage bull"? While we are seeing signs of exhaustion, technical confirmation requires Bitcoin to reclaim and sustain a weekly close above the 200-week Simple Moving Average (SMA). This level sits at approximately $62,660. Until this threshold is maintained, the market remains in a state of consolidation.
However, the accumulation by "whales" during the June outflows provides a strong foundation for the upcoming move. When large-scale holders absorb supply that retail investors are discarding due to fear, it creates a "sticky" floor. If Bitcoin can maintain its volume while holding above the 200-week SMA, the transition from exhaustion to expansion will be confirmed.
Expert Commentary
From a professional trading perspective, we are currently witnessing the "quiet before the storm." The shift in the P&L ratio and the divergence in ETF flows indicate that the "weak hands" have been successfully purged from the system. In many ways, this is the most difficult phase for retail participants to navigate because the lack of immediate volatility can feel like stagnation.
However, we view these metrics as a clear signal of structural health. The whale accumulation during high-outflow periods suggests that sophisticated capital is positioning itself for the next leg up, recognizing that the macro environment—specifically the softening labor data and the resulting cooling of inflation expectations—is favorable for risk assets. We are no longer looking at a panic market; we are looking at a collection phase. The key for investors now is patience: wait for the confirmation of the 200-week SMA hold, as that will be the final signal that the cycle’s foundation is set.
Google Search Preference
Add Fintech Monster to your preferred sources
Never miss deep, analytical fintech insights. Prioritize our stories in your Google Search, Discover feed, and AI Overviews with one click.
About the Author
Fintech Monster
Fintech Monster is run by a solo editor with over 20 years of experience in the IT industry. A long-time tech blogger and active trader, the editor brings a combination of deep technical expertise and extended trading experience to analyze the latest fintech startups, market moves, and crypto trends.