Bitcoin Futures Equilibrium: What a Near 50/50 Long/Short Ratio Signals for Institutional Trading
Key Takeaways
The persistently balanced long/short ratio in Bitcoin perpetual futures indicates deep market indecision, signaling that major directional moves are likely predicated on fundamental catalysts rather than pure speculation.
The analysis of Bitcoin’s (BTC) perpetual futures long/short ratio across major global exchanges consistently points to a state of profound market equilibrium. In quantitative finance, this ratio is considered a critical, real-time barometer of market bias, measuring the proportion of open long positions versus open short positions. When this metric hovers near the 50% mark, it does not signal apathy; rather, it signifies a highly sophisticated state of caution among professional and institutional traders who are carefully balancing their exposure, often preceding periods of significant consolidation or rapid, directional price acceleration.
Historically, deviations far from the 50% mark have signaled strong, one-sided speculative fervor—be it excessive bullish optimism (over-leveraged long) or panic selling (over-leveraged short). The current sustained balance, however, suggests that the market has largely absorbed the immediate directional momentum. Professional capital is positioned not for a quick, speculative bet, but for a fundamental shift. This suggests that the next major wave of price discovery will likely be triggered by powerful external catalysts, such as macro-economic shifts, significant regulatory changes, or major network upgrades, rather than simple speculative hype.
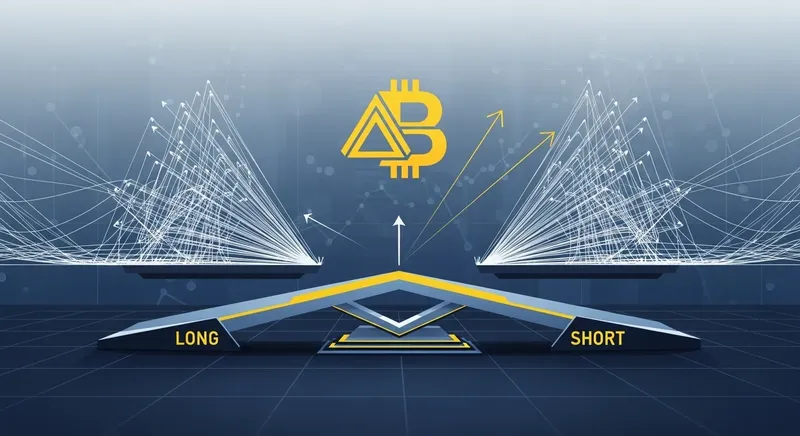
Why Does the Long/Short Ratio Matter in Quantitative Trading?
At its core, the long/short ratio is a simple but incredibly powerful indicator of net market conviction. It is not a measure of trading volume—which can be artificially inflated—but rather a measure of open interest (OI). Open interest represents the total number of outstanding derivative contracts (both long and short) that have not been settled. Therefore, the ratio gives a view of committed capital, showing how much actual risk is outstanding in the system. A balanced ratio suggests that for every speculative dollar committed to buying, a comparable dollar has been committed to selling.
This inherent balance implies a high level of systemic risk management. Institutions and sophisticated hedge funds do not place massive, one-sided bets lightly; they hedge. The persistent equilibrium confirms that large players are maintaining a sophisticated 'fence-sitting' position—waiting for confirmation that a structural advantage (either bullish or bearish) has been established before committing significant, irreversible capital.
Understanding the Technical Implications of Market Equilibrium
From a purely technical analysis standpoint, a balanced long/short ratio signals that the market is in a "battleground" phase. This is often misinterpreted by retail traders who expect perfect neutrality. In reality, this state of equilibrium means the market has stabilized after its most dramatic, single-direction moves.
The critical takeaway here is the distinction between stability and stagnation. A balanced ratio does not mean price action will be flat; it means that when the inevitable breakout occurs, the initial price move could be amplified dramatically by forced liquidations. If price breaks out above a major resistance level, the small, initial imbalance in the ratio—the slight over-commitment of long positions—can trigger cascade liquidations of short positions, fueling parabolic price acceleration. Conversely, a bearish breakout could similarly liquidate overly long positions. The equilibrium, therefore, represents a highly volatile trigger point.
Are Cross-Exchange Differences a Warning Signal?
While the aggregate ratio is the primary focus, the most revealing insights often come from analyzing divergences across individual major exchanges. Because derivatives activity is siloed among various platforms (e.g., Binance, OKX, Bybit), a comparison of these localized ratios can highlight where specific, highly capitalized groups are accumulating risk or making concentrated directional bets.
For instance, if the global aggregate ratio is near 50/50, but one specific, large exchange shows a significantly more bullish ratio (say, 60/40), it indicates that a substantial, institutional segment of the market is developing a conviction that is not yet reflected in the broader, consensus data. This divergence acts as a crucial early warning system. It signals that while the general market is pausing for breath, a specific high-net-worth segment is making calculated, powerful positioning moves, potentially preceding a localized price spike or a broader, confirmed reversal.
Navigating Methodological Nuances: Open Interest vs. Volume
It is absolutely imperative to reiterate the technical difference between what the ratio measures and what the common person assumes it measures. The ratio is predicated entirely on Open Interest (OI), not total trading volume.
This is a crucial distinction. High trading volume can occur for many reasons—profit-taking, speculative noise, or mandatory liquidation. However, high open interest means that a large amount of directional capital has been locked into the market, representing genuine, held directional bets. When the ratio is heavily skewed (e.g., much higher open interest on long calls than short puts), it signals the underlying directional bias of the largest players, regardless of the daily volume noise. Therefore, professional analysts place significantly more weight on the open interest metrics than on simple volume metrics.
The current state of near-perfect equilibrium suggests that major bullish and bearish forces are balanced, leading to a consolidation phase. However, this stability inherently points to the potential for a sharp directional break once one side exhausts its immediate capacity to absorb losses or generate profits. Instead of focusing on the precise daily ratio, it is more critical to track the rate of change and significant divergence in open interest across different derivatives markets. A sudden shift in this balance could easily trigger cascades of forced liquidations, resulting in rapid, high-velocity price movements.
Google Search Preference
Add Fintech Monster to your preferred sources
Never miss deep, analytical fintech insights. Prioritize our stories in your Google Search, Discover feed, and AI Overviews with one click.
About the Author
Fintech Monster
Fintech Monster is run by a solo editor with over 20 years of experience in the IT industry. A long-time tech blogger and active trader, the editor brings a combination of deep technical expertise and extended trading experience to analyze the latest fintech startups, market moves, and crypto trends.